Problem
Find solution for $\Phi(\rho, \theta)$ inside a circular region of radia $a$. The region is enclosed by a circle with the radius $a$, is maintained at potential $−V$ in the upper half circle and at potential $+V$ in the lower half circle as shown in the figure.
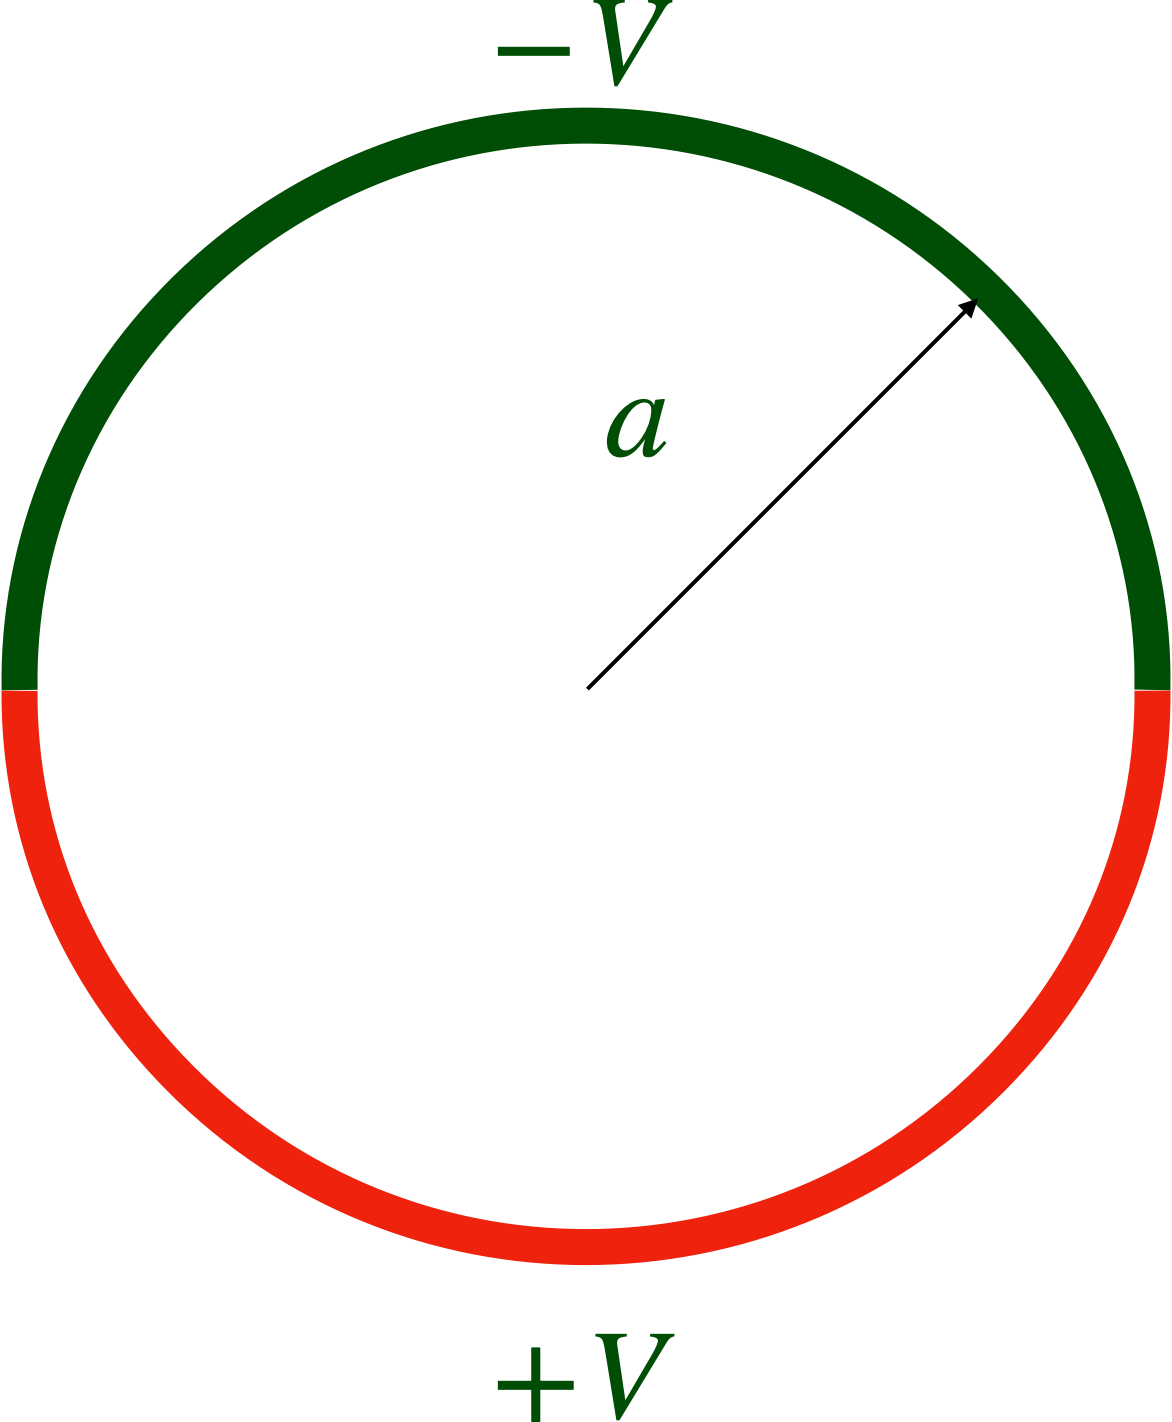
The system is axially symmetric and $\rho < a$. Hence, the solution can be written as, \begin{equation} \Phi = \sum_{l=0}^{\infty}\, A_l \left(\frac{\rho}{a}\right)^l P_l \left(\cos\theta\right) \end{equation} We need to find $A_l$'s using the boundary condition on the circle. $$ \Phi(r=a, \theta) = \left\{ \begin{array}{cc} +1 & \left(\cos\theta<0\right)\\ -1 & \left(\cos\theta\geq0\right) \end{array}\right. $$ Using the result form step function expressed terms of Legendre Polynomials, $$ f(x) = \frac 32 P_1(x) - \frac 78 P_3(x) + \frac{11}{16} P_5(x) + \cdots $$ we get $$ \Phi \left(\rho, \theta \right) \, = \, V \left[ \frac 32 \left(\frac{\rho}{a}\right) P_1(\cos\theta) - \frac 78 \left(\frac{\rho}{a}\right)^3 P_3(\cos\theta) + \frac{11}{16} \left(\frac{\rho}{a}\right)^5 P_5(\cos\theta) + \cdots\right] $$
